
Part-II
Chapter-2: Data Processing
Excercises
1. Choose the correct answer from the four alternatives given below:
(i) The measure of central tendency that does not get affected by extreme values:
(a) Mean (b) Mean and Mode
(c) Mode (d) Median
Answer: (d) Median
(ii) The measure of central tendency always coinciding with the hump of any
distribution is:
(a) Median (b) Median and Mode
(c) Mean (d) Mode
Answer: (d) Mode
2. Answer the following questions in about 30 words:
(i) Define the mean.
Answer: The mean, also commonly called the "average," is a measure of central tendency in statistics. It represents the sum of all values in a dataset divided by the number of values. It tells you what a typical value in the dataset would be if you distributed all the values equally amongst the data points.
For example, if you have a set of numbers {2, 4, 7, 4, 10}, the mean would be (2 + 4 + 7 + 4 + 10) / 5 = 5.6.
(ii) What are the advantages of using mode ?
Answer: The mode's easy to calculate, unaffected by outliers, works with categories, shows common values, and offers clear interpretation. However, it can be unreliable in some cases. Choose wisely!
3. Answer the following questions in about 125 words:
(i) Explain relative positions of mean, median and mode in a normal distribution and skewed distribution with the help of diagrams.
Answer: Relative Positions of Mean, Median, and Mode in Different Distributions:
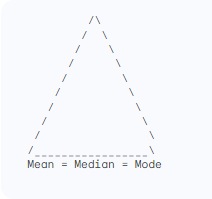
Normal Distribution:
A normal distribution, also known as a bell curve, is symmetrical and has a single peak. In this distribution, the mean, median, and mode all coincide at the center of the curve, represented by the peak. This is because the symmetrical nature ensures that the most frequent value (mode), the middle value (median), and the average value (mean) all fall on the same point.
Here's a diagram illustrating this:

2. Negatively Skewed: The tail extends to the left, and the mean is pulled towards the left side of the distribution. Here, the order becomes: Mean < Median < Mode.

*Understanding the Diagrams:
*The y-axis represents the frequency or density of data points.
*The x-axis represents the values in the dataset.
*The shaded areas represent the portion of data points lying below each measure of central tendency.
By observing the relative positions in these diagrams, you can quickly understand the shape and bias of a distribution based on the relationship between the mean, median, and mode.
(ii) Comment on the applicability of mean, median and mode (hint: from their merits and demerits).
Answer: The choice between mean, median, and mode as measures of central tendency depends on the specific characteristics of your data and your research goals. Each has its own merits and demerits:
*Mean:
*Merits: Simple to calculate, provides an "average" value, works well for normally distributed data.
*Demerits: Sensitive to outliers, can be misleading for skewed data, doesn't represent the most frequent value.
*Median:
*Merits: Robust to outliers, reflects the middle value, works with ordinal data.
*Demerits: Not as intuitive as the mean, doesn't give information about the spread of data, depends on the number of data points in some cases.
*Mode:
*Merits: Easy to calculate, unaffected by outliers, highlights most frequent value, works with nominal data.
*Demerits: Unreliable for multimodal data, doesn't provide information about dispersion, doesn't always represent a central value.
Here's a summarized applicability guideline:
Normally distributed data: Use any of the measures, as they will likely coincide.
*Skewed data: Use the median as it's resistant to outliers and represents the central tendency better than the mean.
*Data with outliers: Use the median or mode as they are less affected by extreme values.
*Nominal data: Use the mode as it focuses on the most frequent category.
*Need for average value: Use the mean if the data is not skewed and outliers are minimal.
*Focus on typical value: Use the mode if you're interested in the most common occurrence.
Ultimately, the best approach is to consider your data and research goals, understand the merits and demerits of each measure, and choose the one that best provides the information you need. Sometimes, using all three measures and comparing them can offer a more comprehensive picture of the data.
Activity
1. Take an imaginary example applicable to geographical analysis and explain
direct and indirect methods of calculating mean from ungrouped data.
Answer Type By : Himashree Bora.


